Monitoring the heap memory usage of a Service Container |
Heap memory is an internal memory pool which is created when the Service Container or Java Virtual Machine(JVM) is started. In heap Memory, the memory is allocated dynamically as needed.
The monitoring of the heap memory usage of WS-Apps Service Container is described below.
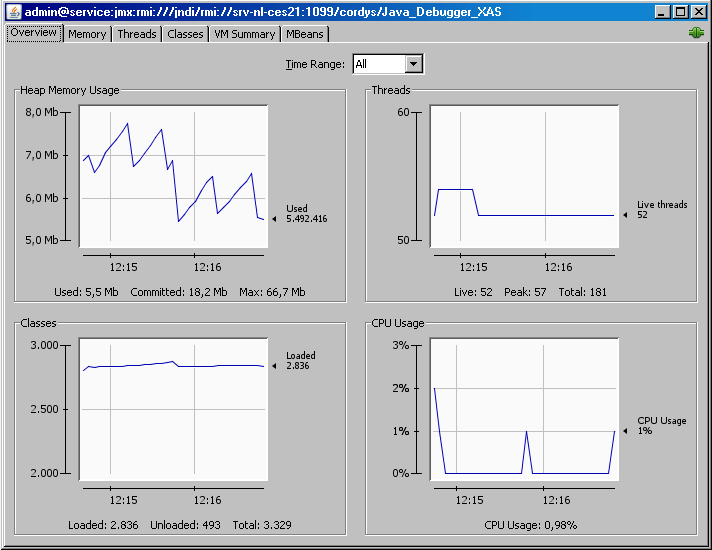
- After connecting to JConsole using the JMX address URL of the WS-Apps Service Container, click overview tab in the interface.
- In the Overview tab you can see the Heap Memory Usage of the Service Container along with the created Threads and loaded Classes.
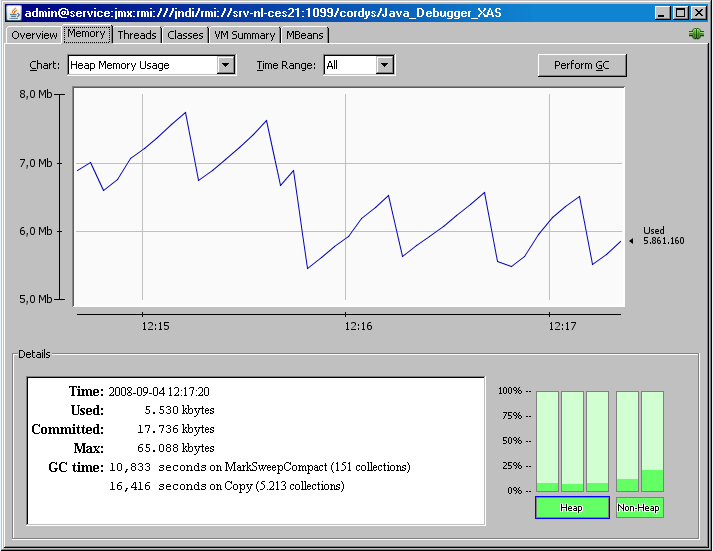
- In the Memory tab you can see the heap memory usage of the Service Container and if you want to perform garbage collection forcefully, click Perform GC button.
2. Run the Web Services specific to WS-Apps Service container for a multiple number of times and observe the memory graph. In the below graph, there is an upward trend of the memory usage for each run of the Web Service.